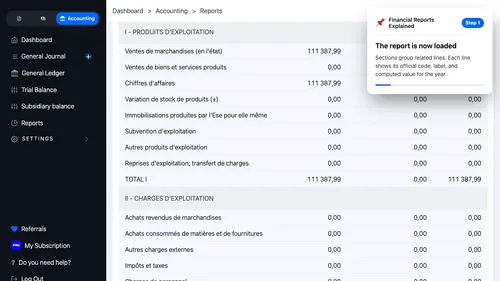
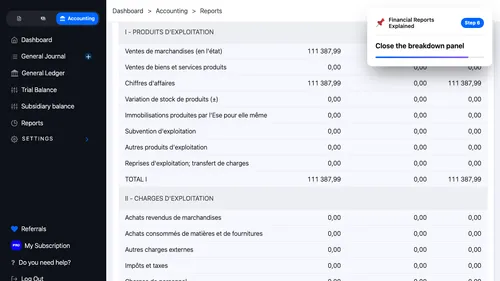
1 Reading the Report The report is now loaded. Sections group related lines. Each line shows its official code, label, and computed value for the year. ▾ ▶ 0:10
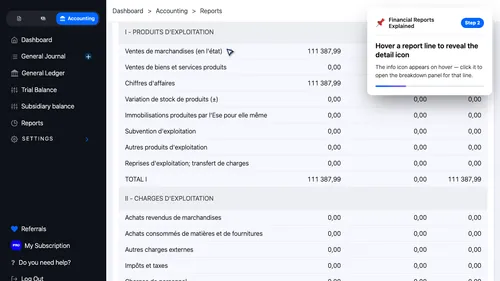
2 Drill Into a Figure Hover a report line to reveal the detail icon. The info icon appears on hover — click it to open the breakdown panel for that line. ▾ ▶ 0:21
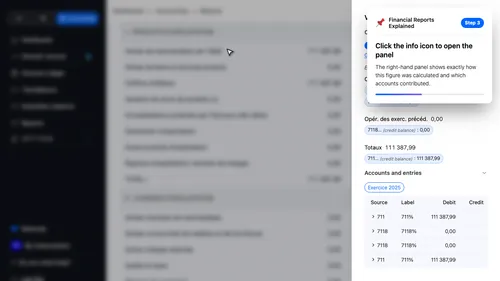
3 Breakdown Panel Click the info icon to open the panel. The right-hand panel shows exactly how this figure was calculated and which accounts contributed. ▾ ▶ 0:31
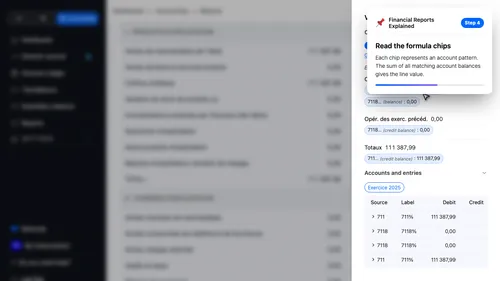
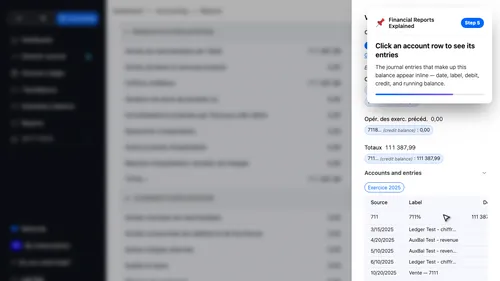
4 Formula and Sources Read the formula chips. Each chip represents an account pattern. The sum of all matching account balances gives the line value. ▾ ▶ 0:42
5 Account Entries Click an account row to see its entries. The journal entries that make up this balance appear inline — date, label, debit, credit, and running balance. ▾ ▶ 0:51
6 Close the Panel Close the breakdown panel ▾ ▶ 1:02
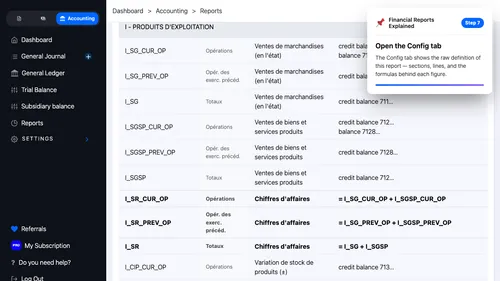
7 Report Configuration Open the Config tab. The Config tab shows the raw definition of this report — sections, lines, and the formulas behind each figure. ▾ ▶ 1:07